UL first launched its Intel XeSS feature test in October 2022, the same month Intel introduced the Arc A750 and Arc A770. Intel presented its AI-based upscaling capability at its Architecture Day in August 2021. XeSS is a temporal (using information from current and previous frames) upscaling algorithm that runs games at lower resolutions before scaling them up to higher resolutions. XeSS is Intel’s answer to Nvidia’s DLSS and AMD’s FidelityFX.
What do we think? UL’s new XeSS feature test is an invaluable tool to measure performance gains over generations of Intel’s upscaling software. The feature test provides six modes—from performance and quality to balanced—that put graphics cards under multiple stresses. The XeSS feature test contributes to 3DMark being one of the best places for players to assess the capabilities of cutting-edge gaming technologies. XeSS 1.3.1 provided double-digit percentage gains over XeSS 1.0, underscoring the fact that Intel has made big improvements in its scaling software.
3DMark’s new XeSS feature test
Intel’s latest version of XeSS 1.3.1 was introduced in April 2024. The newest version of XeSS delivers improvements through updated AI models via model optimizations and additional training. According to Intel, the new XeSS provides more detailed reconstruction, improved anti-aliasing, less ghosting, and more temporal stability. Intel says XeSS 1.3.1 improves performance by 10% over the previous version of XeSS.
UL released the latest version of its XeSS feature test, available on the 3DMark benchmarking platform, earlier this month. To assure a best-practice XeSS implementation, UL created the new test with input from Intel. The new version of the XeSS feature test allows the user to run the suite using XeSS 1.0, 1.1, 1.2, and 1.3.1, providing a way to compare the performance breakdown of the various generations of the Intel software.
UL implemented the XeSS Feature Test Frame Inspector tool, which allows the player to export individual frames for comparison between different quality levels and XeSS versions.
UL’s new XeSS feature test may be executed using seven distinct settings, ranging from Performance modes, which focus on frame rates, to Quality modes, which prioritize frame quality. The native mode upscales the images to 1440p; higher and lower resolutions are also supported.
| Mode | Default resolution upscaled to 1440p and 4K |
| Balanced | 1280×720 |
| Performance | 1114×627 |
| Ultra Performance | 854×480 |
| Quality | 1506×848 |
| Ultra Quality | 1707×960 |
| Ultra Quality Plus | 1970×1108 |
Modes with default resolutions.
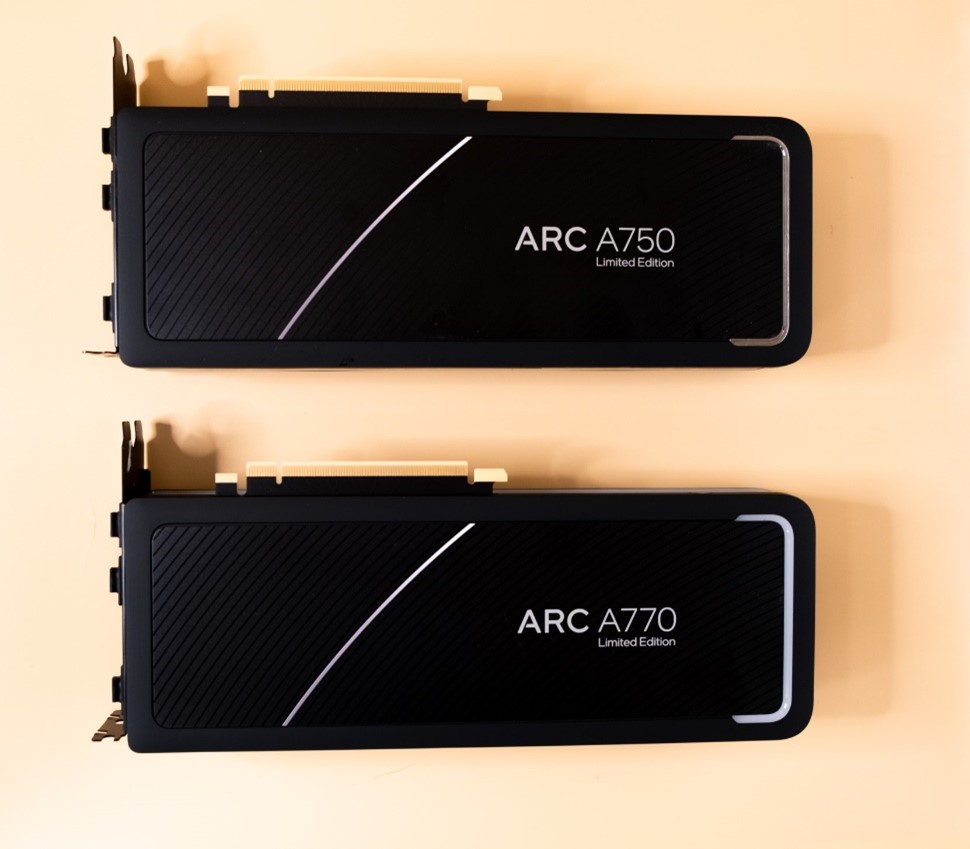
We examined the new XeSS feature test using Intel’s Arc A750 and Arc A770 add-in graphics cards.
| Arc A770 | Arc A770 | |
| GPU architecture | Alchemist | Alchemist |
| Process (nm) | 6 | 6 |
| Transistors (mm²) | 21,700 | 21,700 |
| Cores | 4,096 | 3,584 |
| Tensor cores | 512 | 448 |
| RT cores | 32 | 28 |
| Base clock (MHz) | 2,100 | 2,050 |
| Boost clock (MHz) | 2,400 | 2,400 |
| Memory clock (MHz) | 2,000 | 2,000 |
| Memory size (GB) | 16 | 8 |
| Memory type | GDDR6 | GDDR6 |
| Memory bus | 256-bit | 256-bit |
| Bandwidth (GB/sec) | 512 | 512 |
| Fill rate (TFLOPS) | 39.32 | 17.2 |
| TDP (W) | 225 | 225 |
| MSRP (at launch) | $329 | $289 |
Intel Arc A770 and A750 specifications.
1440p testing and results
We tested Intel’s Arc A750 and Arc A770 on the XeSS in multiple modes in 1440p, comparing XeSS 1.3.1 vs. XeSS 1.0.
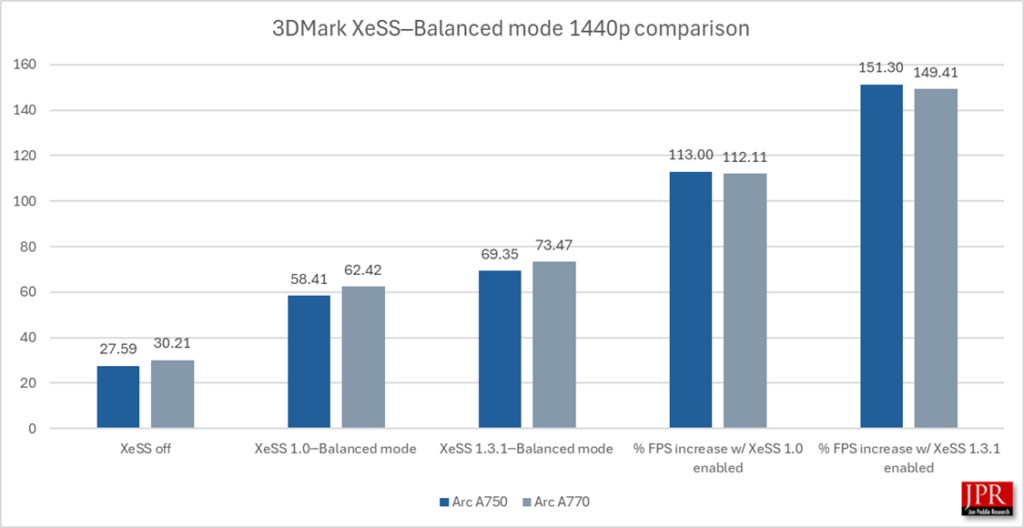
XeSS 1.3.1─Balanced mode provided a 150% performance over running the benchmark without sampling and an 18% average frame rate gain over XeSS 1.0.
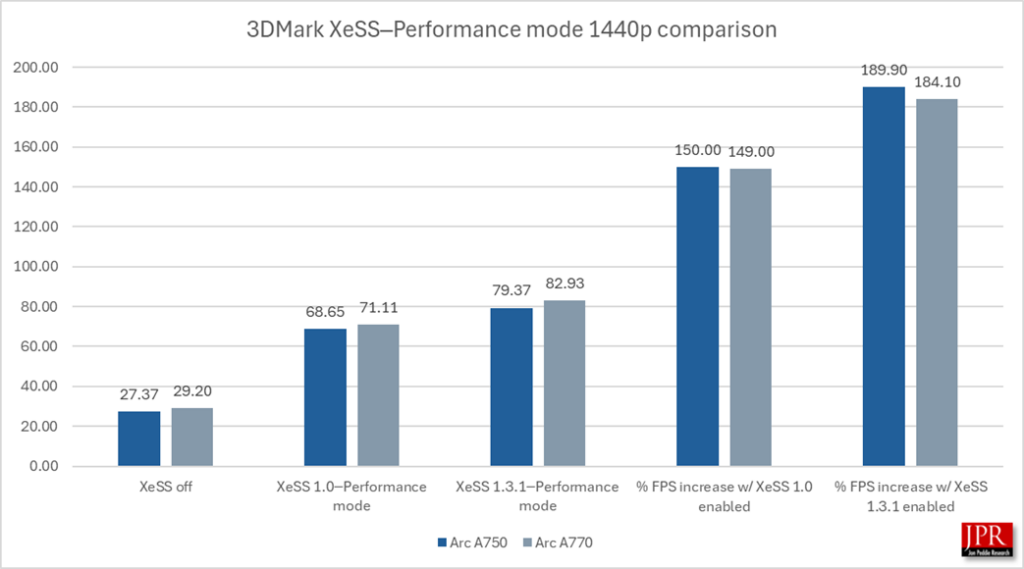
XeSS 1.3.1─Performance mode provided over a 185% performance increase over running the benchmark without sampling, and a 15.5% average frame rate gain over XeSS 1.0.
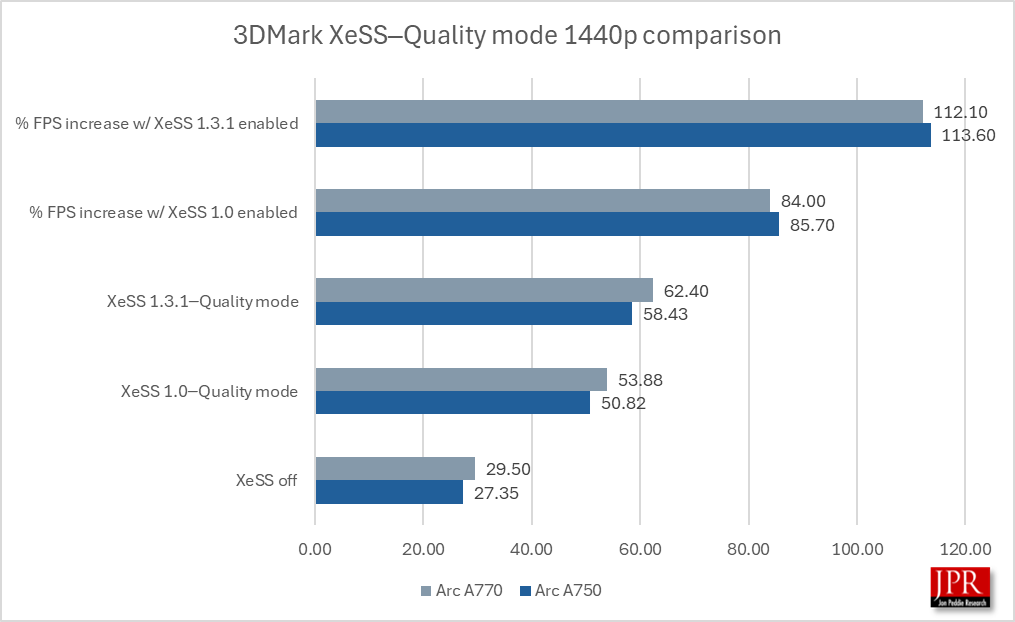
XeSS 1.3.1─Quality mode provided a 112% performance gain over running the benchmark without sampling, and a 15% average frame rate gain over XeSS 1.0.
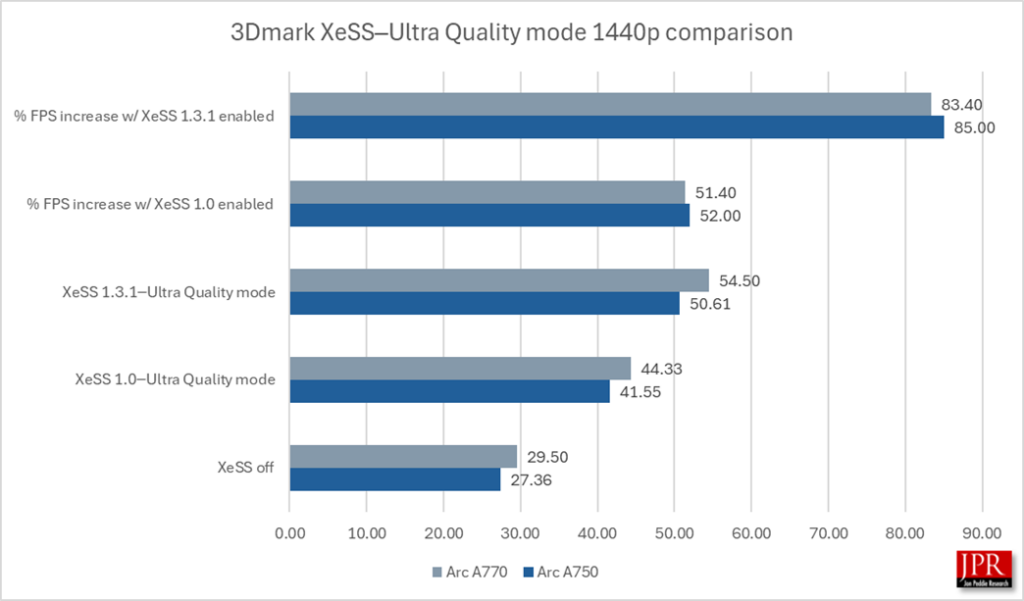
XeSS 1.3.1─Ultra Quality mode provided an 84% performance gain over running the benchmark without sampling, and a 22% average frame rate gain over XeSS 1.0.
4K testing and results
3DMark’s XeSS feature tests offer six different modes of XeSS scaling; however, XeSS 1.0 is only capable of running in Balanced, Performance, Quality, and Ultra Quality modes. We tested the Arc A750 and A770 with these four scaling options in 4K.
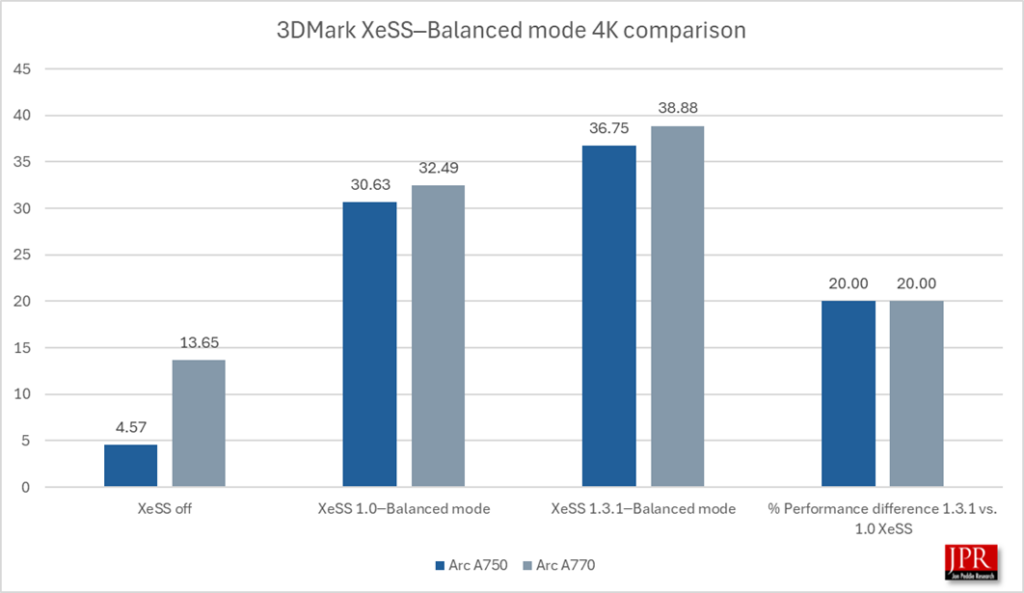
XeSS 1.3.1─Balanced mode provided a 20% gain in average frame rate over XeSS 1.0 running in 4K.
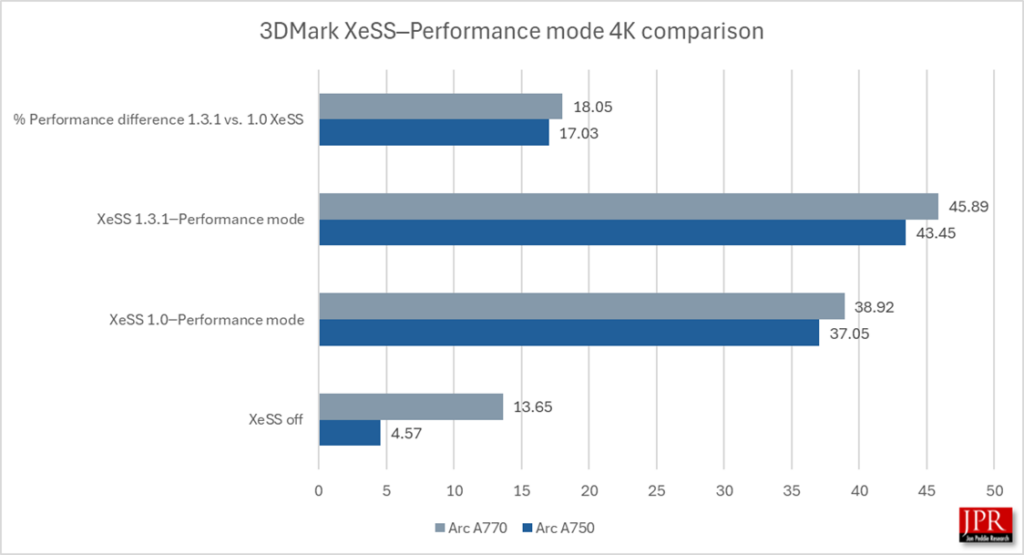
XeSS 1.3.1─Performance mode provided a 17.5% gain in average frame rate over XeSS 1.0 running in 4K.
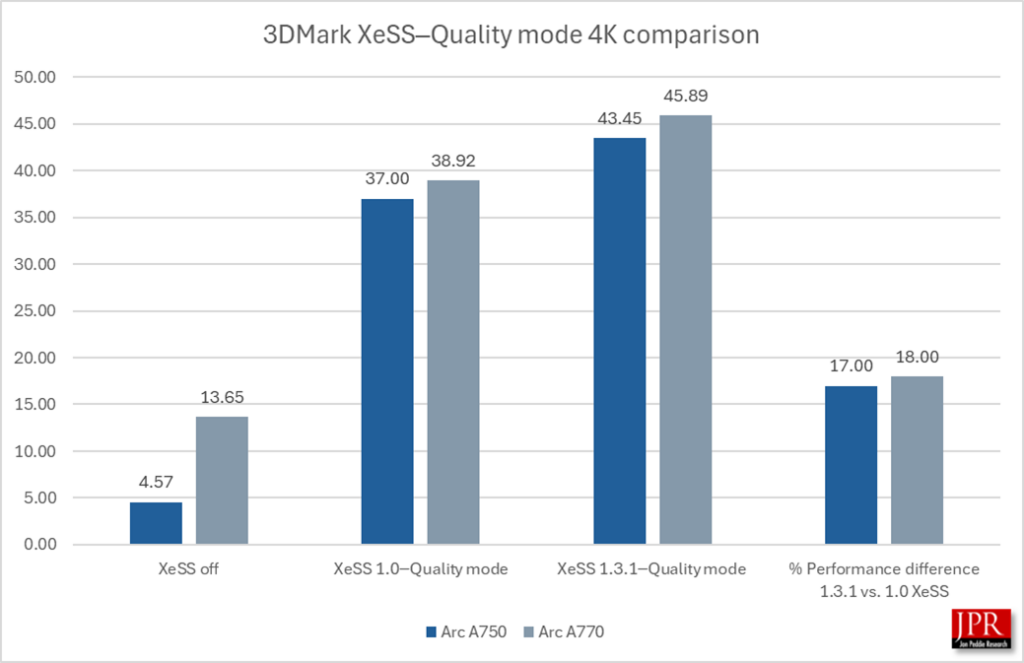
XeSS 1.3.1─Quality mode provided a 17% gain in average frame rate over XeSS 1.0 running in 4K.
Quality mode and Ultra Quality mode are geared to providing FPS but also the quality of the image.
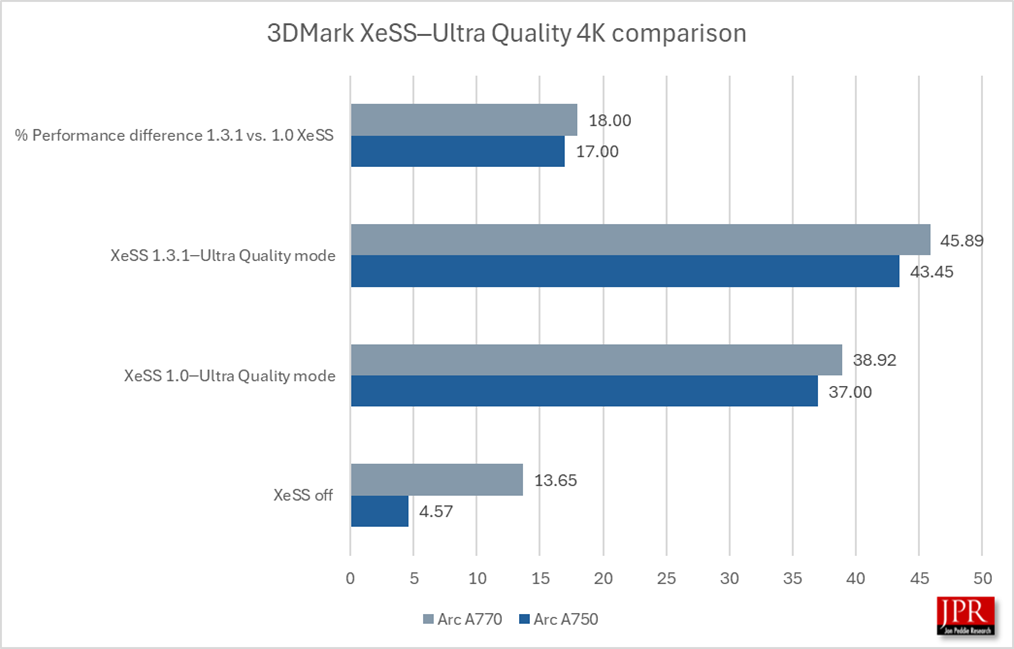
XeSS 1.3.1─Ultra Quality mode provided a 17% gain in average frame rate over XeSS 1.0 running in 4K.
XeSS 1.3.1 showed a remarkably consistent 17% to 18% performance gain over XeSS 1.0 in all four modes running in 4K.