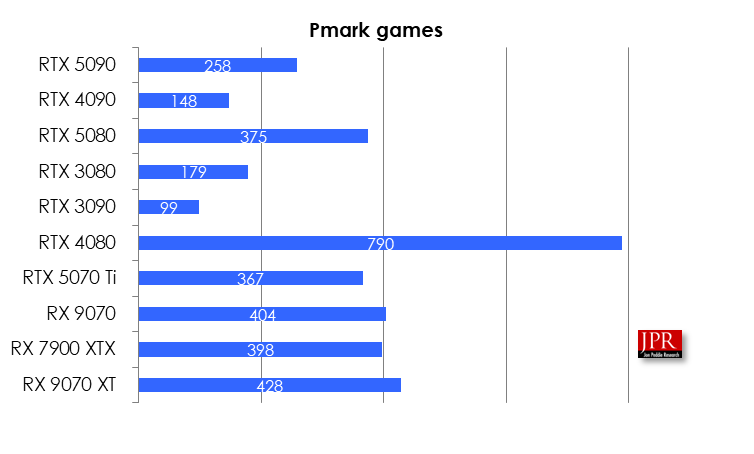
AMD released the RX 9070 XTX and RX 9070 graphics AIBs, and we obtained samples for testing. We compared their performance to previous-generation AMD boards and Nvidia AIBs, running numerous benchmark tests at different resolutions. The testing process involved a large number of tests, including special FSR 4 tests on the AMD boards. We then calculated the PMark for each board, which takes into account performance, price, and power consumption. The performance value was based on the average of game scores.

AMD released two new AIBs, the RX 9070 XTX and the RX 9070. We reported on their characteristics and specifications here. We were also fortunate to get some samples to test at our Mt. Tiburon Testing Lab (MTTL). And test them we did, against a previous-generation AMD board, the RX 7900 XTX, five 5000-series boards, and two 400-series Nvidia AIBs, and conducted 12 benchmark tests at two resolutions (192 tests).
We ran 58 tests on the 10 AIBs at two resolutions (1,160 tests), plus 12 special FSR 4 tests at two resolutions on the three AMD AIBs (72 tests), for a total of 1,424 tests.
And then we calculated the PMark for the various boards. PMark is the product of performance over price times the reciprocal of power. We used the average of the game scores for the performance value.

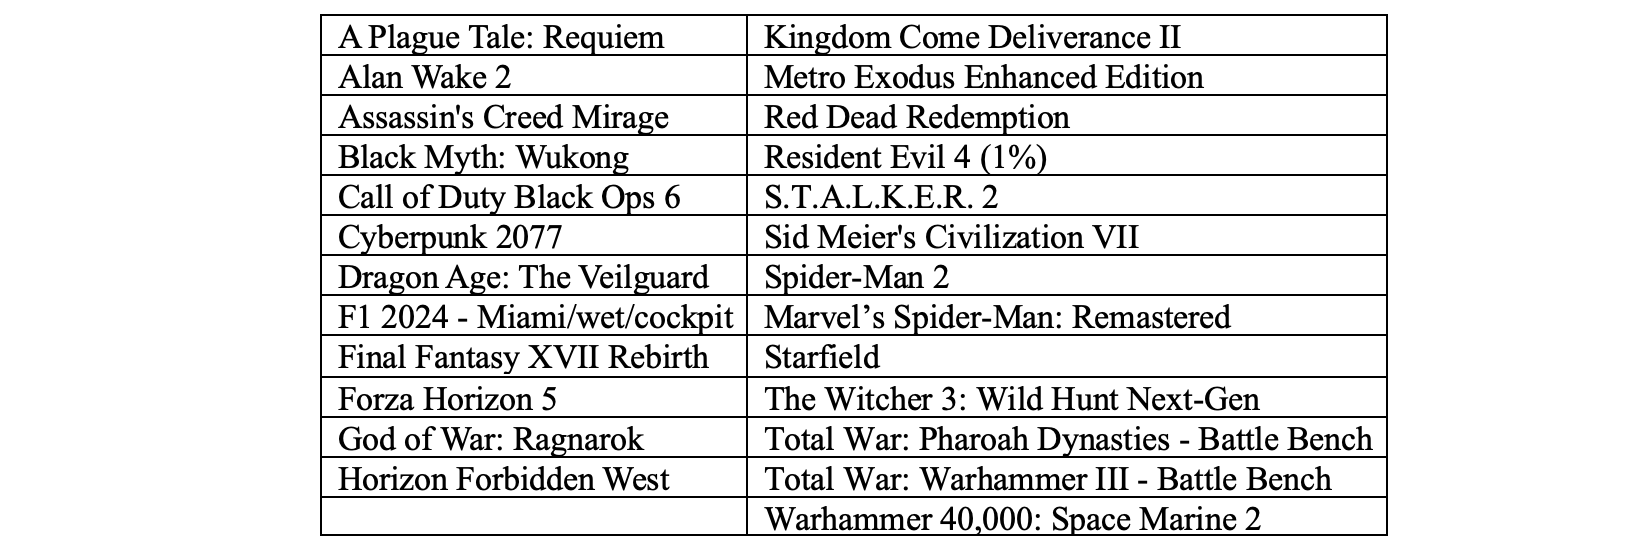
The games tested are shown in the following table.

Some of the games were run multiple times to try different settings. As a result, the 10 AIBs, run at two resolutions for 1,160 game tests generating 1,424 results.
We also ran synthetic benchmarks and got the following results. Note: Some of the tests produce a score, while others produce frames per second (fps) and some both.
You can find the large spreadsheet of test data here and download it at no charge.
For more information on the AMD RX 9070 XTX and how it held up in testing, jump over to our BabelTechreviews page and check it out.

LIKE WHAT YOU’RE READING? INTRODUCE US TO YOUR FRIENDS AND COLLEAGUES.