
The Ryzen 7 9800X3D is designed for PC gaming. Its new CPU is built on the Zen 5 architecture and has second-generation AMD 3D V-Cache technology. The processor is available for a modest price of $479.
What do we think? AMD modified the onboard cache memory on the new Ryzen 7, moving it below the processor and bringing the core complex chip closer to the cooling solution. This innovative architecture keeps the cores cooler, allowing for higher clock rates and overclocking. The clock rates enable the Ryzen 7 9800X3D to compete with more expensive processors and CPUs with more cores and threads. Our benchmarking allowed the Ryzen 7 9800X3D to achieve impressive performance numbers and Pmark scores.
The Ryzen 7 9800X3D, engineered for gaming
The Ryzen 7 9800X3D is equipped with eight high-performance Zen 5 processor cores and 16 threads. It has a base clock speed of 4.7 GHz and can boost to 5.2 GHz, which is the maximum clock speed achieved on an X3D chiplet. With a 120W TDP and 104MB of total cache, AMD claims the chip can handle both gaming and demanding productivity workloads.
AMD promises to provide top-tier CPU gaming performance by combining the powerful Zen 5 processor architecture with 3D V-Cache technology. While the average frame rate (fps) improvement over the previous generation is roughly 8%, some games will see much greater performance gains.
Testing the new CPU
We ran the Ryzen 7 9800X3D through a series of benchmarks to assess its gaming performance as well as productivity workloads.

| AMD Ryzen 7 9800X3D | Intel Core i9-13900K | |
| Foundry | TSMC | Intel |
| Process Size | 4nm | 10nm |
| Transistors | 8,315 million | 12,000 million |
| Die Size | 122mm² | 257mm² |
| Frequency | 4.7 GHz | 3 GHz |
| Boost Clock | 5.2 GHz | 5.8 GHz |
| TDP | 120 | 125 |
| Cores | 8 | 24 |
| Threads | 16 | 32 |
| MSRP (at launch) | $479 | $589 (current online retail $469) |
CPU specifications.
We tested our CPUs with both the AMD RX 7900 GRE graphics add-in board and Nvidia’s RTX 4070 Super. We chose the RX 7900 GRE and RTX 4070 Super because they are comparable in performance and price.
| 3DMark Profile test | 3DMark Night Raid |
| Blender benchmark | Cinebench 2024 |
| Geekbench 6.3 |
CPU test suite.
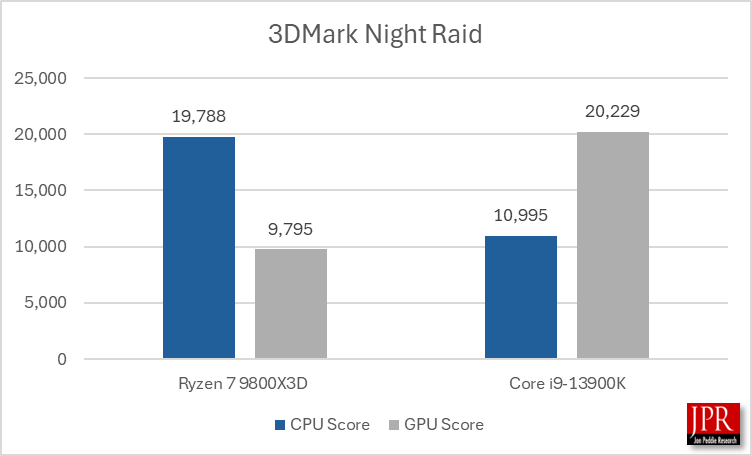
The Ryzen 7 9800X3D performed very well in the Night Raid CPU test, though the onboard Radeon graphics are lacking on the new CPU, which was expected given the CPU is geared for high-performance gaming with a discreet GPU.
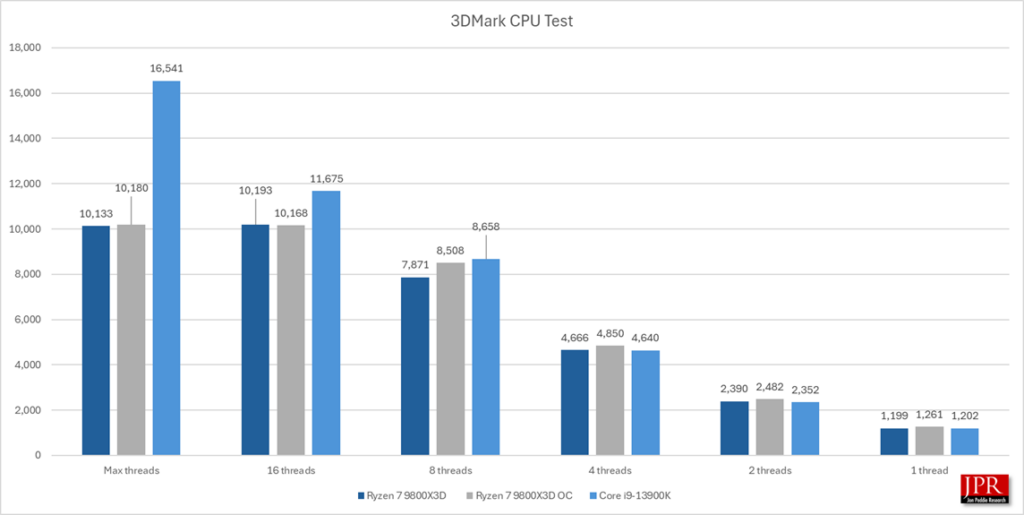
One of the features of the Ryzen 7 9800X3D is its ability to overclock the CPU due to its advanced cooling design. We overclocked the Ryzen 7 with AMD’s Ryzen Master software. The Ryzen Master software allowed us to overclock the CPU by 200 MHz. The overclocking provided the CPU with a slight performance boost. We plan to overclock the new Ryzen 7 even more in upcoming tests.
Geekbench 6.3
The next test we ran was Geekbench 6.3, which assesses a processor’s single-core and multi-core performance. Geekbench 6’s CPU test assesses performance in new application areas such as augmented reality and machine learning, letting you know how close your system is to the bleeding edge.
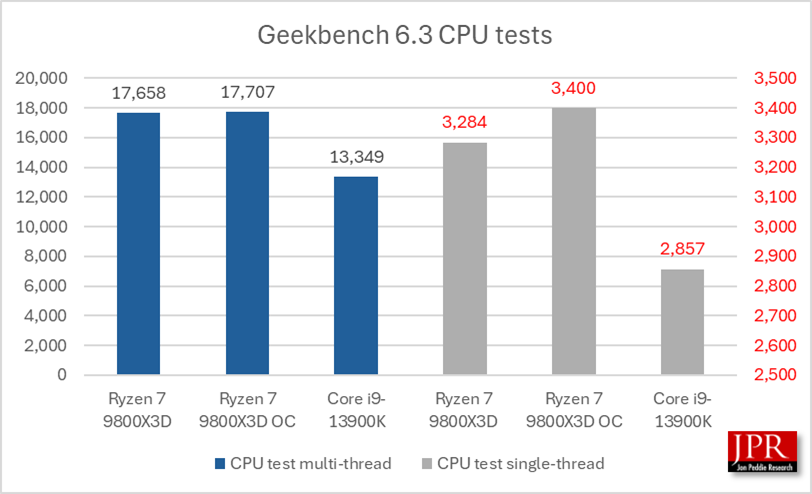
The Ryzen 7 9800X3D saw a 4% increase in the Geekbench single-thread test while overclocked.
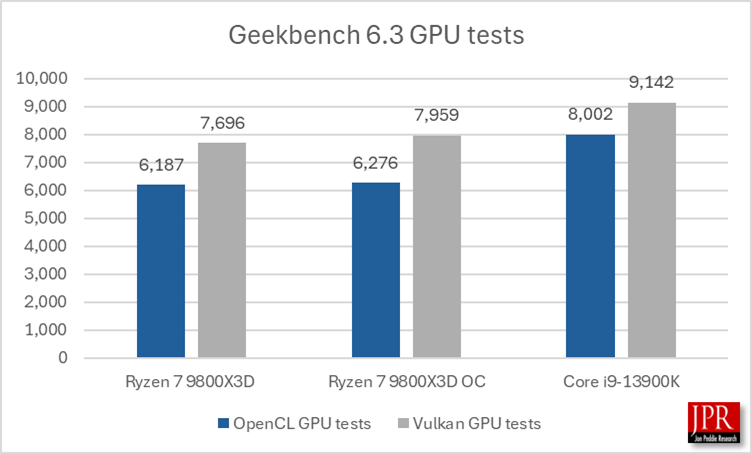
The Core i9-13900K outperformed the new AMD CPU in the Geekbench GPU tests.
Cinebench 2024
Cinebench 2024 uses Redshift, Cinema 4D’s default rendering engine, to analyze a computer’s CPU and GPU performance.
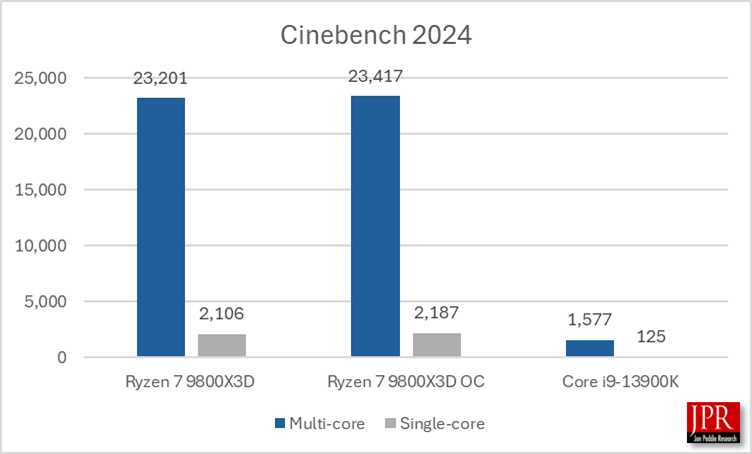
The Ryzen 7 9800X3D performed very well in Cinebench.
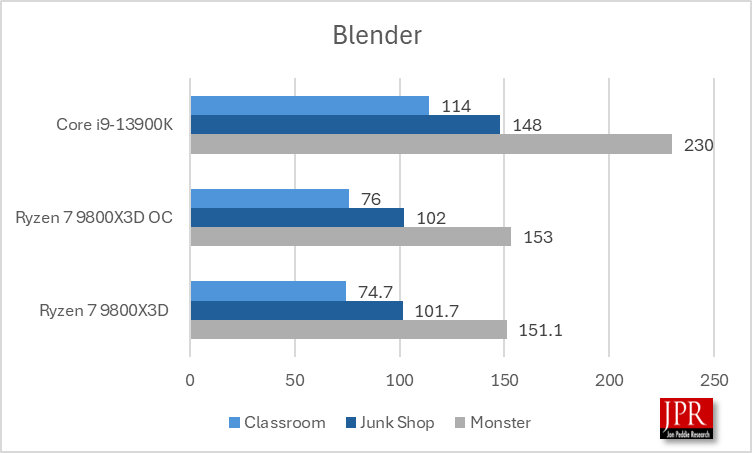
Blender
The Blender benchmark score represents how quickly Cycles can produce path-tracing samples on a single CPU or GPU device. The higher the value, the better. Specifically, it is the estimated number of samples per minute, which is aggregated across all benchmark scenes.
Graphics benchmarks
We tested both the AMD and Intel-based systems with the Radeon RX 7900 GRE and Nvidia RTX 4070 Super graphics cards.
| OS | Win 11 Pro (64-bit) | Win 11 Pro (64-bit) |
| MB | Gigabyte X870 Aorus Master-CF-WCP | Asus TUF Gaming Z790-Plus |
| CPU | Ryzen 7 9800X3D (8 cores, 16 threads) | Core i9-13900K (24 cores, 32 threads) |
| CPU Clock | 4.7 GHz | 3.00 GHz |
| RAM | 32MB | 32MB |
| Storage | Samsung SSD 990 Pro 1TB | Samsung SSD 960 Pro 500MB |
Test beds for the Ryzen 7 9800X3D and Intel i9-13900K.
| 3DMark Steel Nomad | 3DMark Speedway |
| 3DMark DirectX Raytracing feature test | 3DMark DLSS feature test |
| 3DMark AMD FSR feature test | Call of Duty: Black Ops 6 |
| Chernobylite | Cyberpunk 2077 |
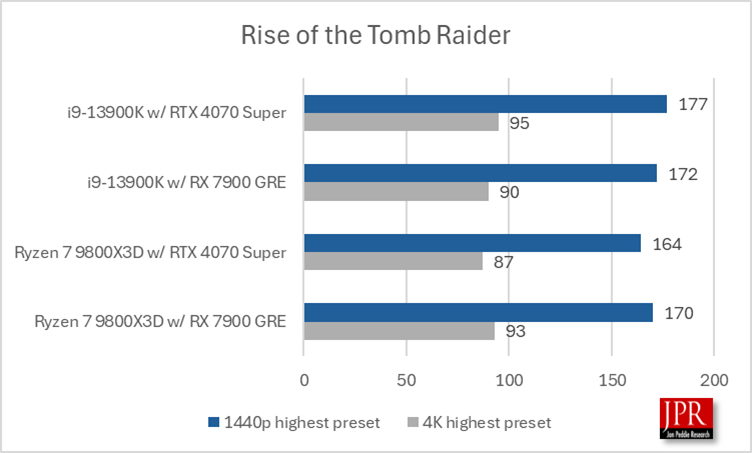
| Rise of the Tomb Raider |
Graphics and gaming test suite.
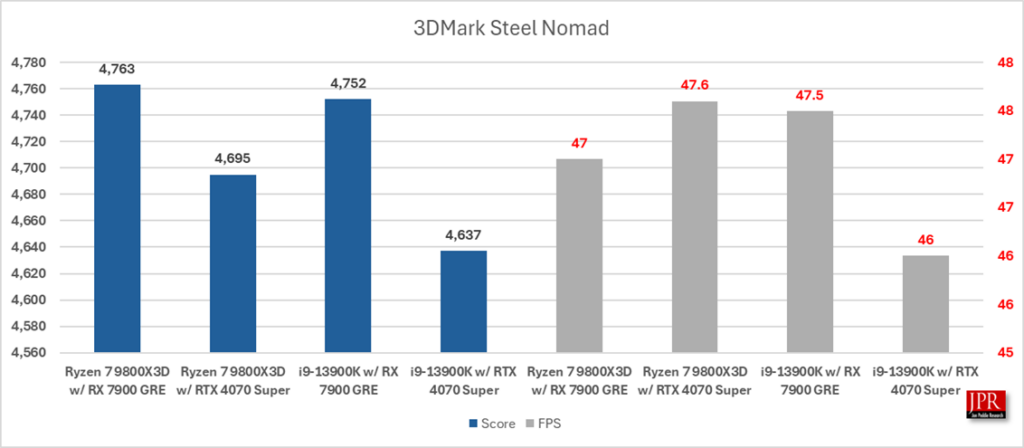
3DMark benchmarks
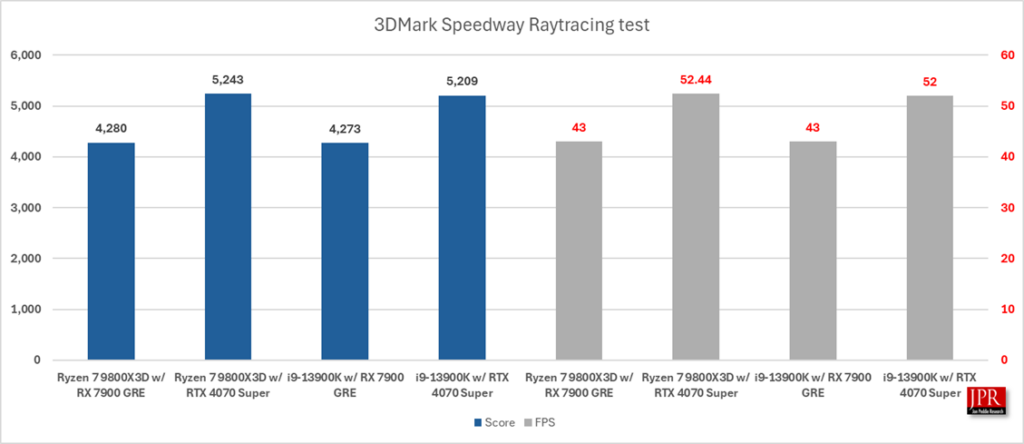
3DMark Speedway is a ray-tracing-based benchmark, and here we see the systems with the RTX 4070 Super AIBs perform well.
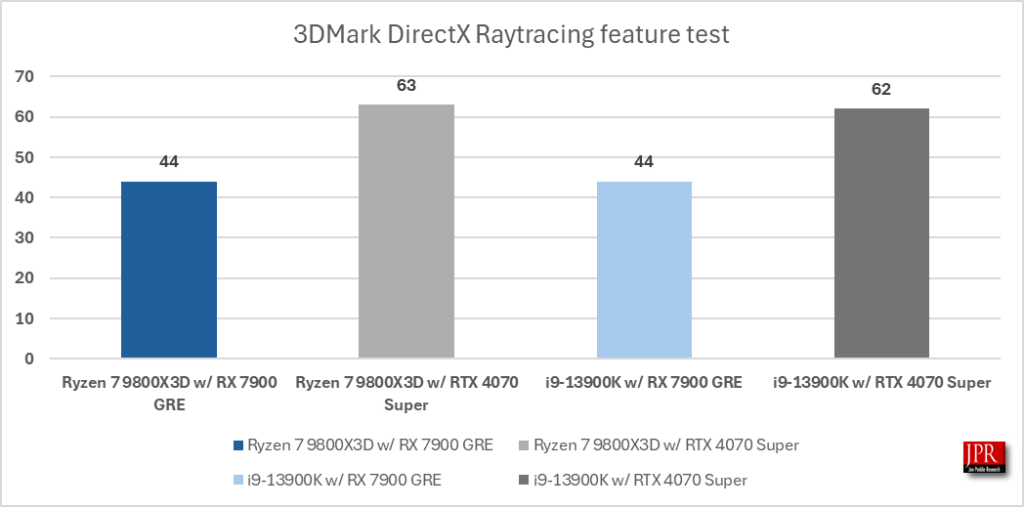
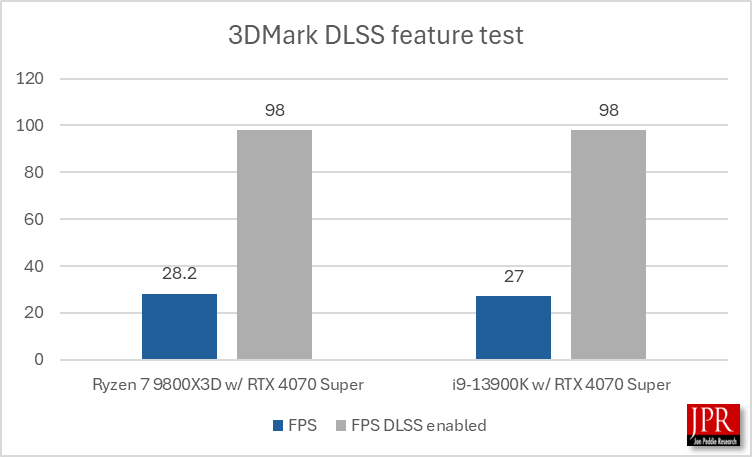
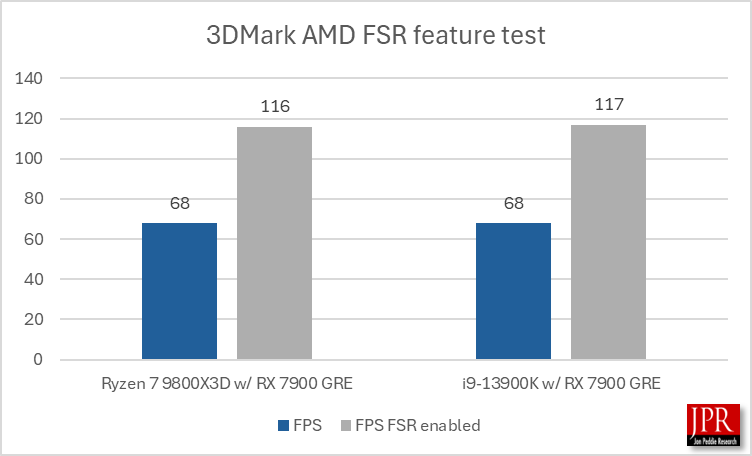
The two computers performed remarkably consistently across the 3DMark benchmarks. There wasn’t much variation in how the systems functioned.
Game testing
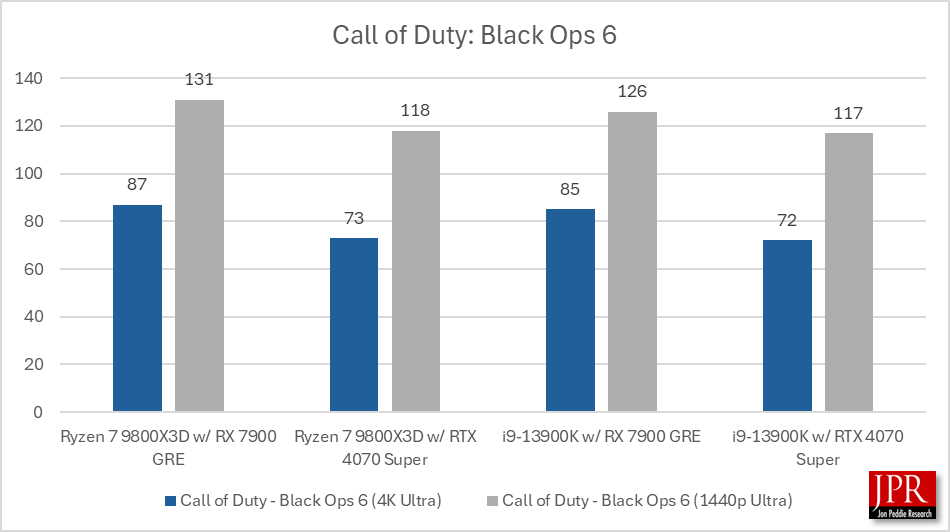
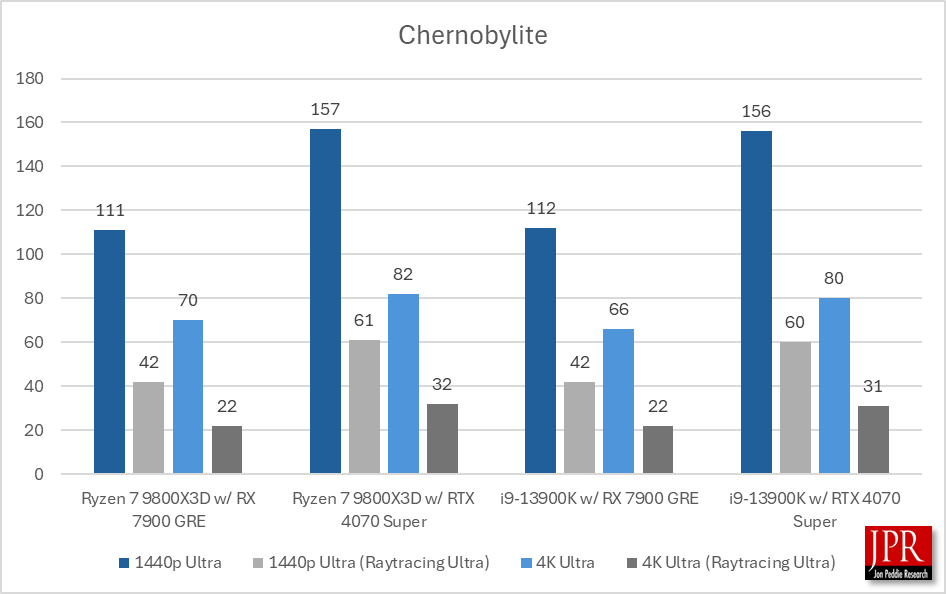
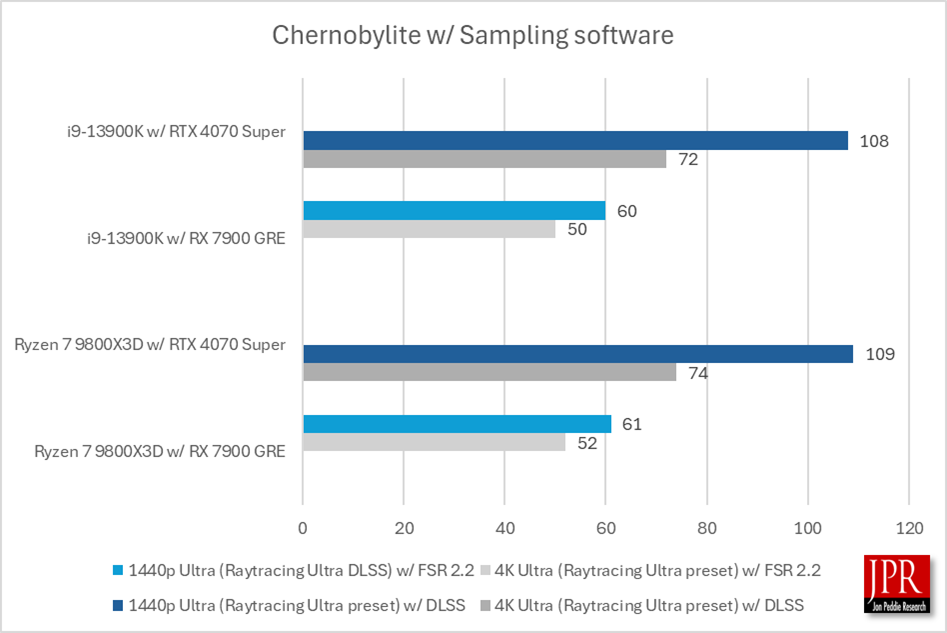
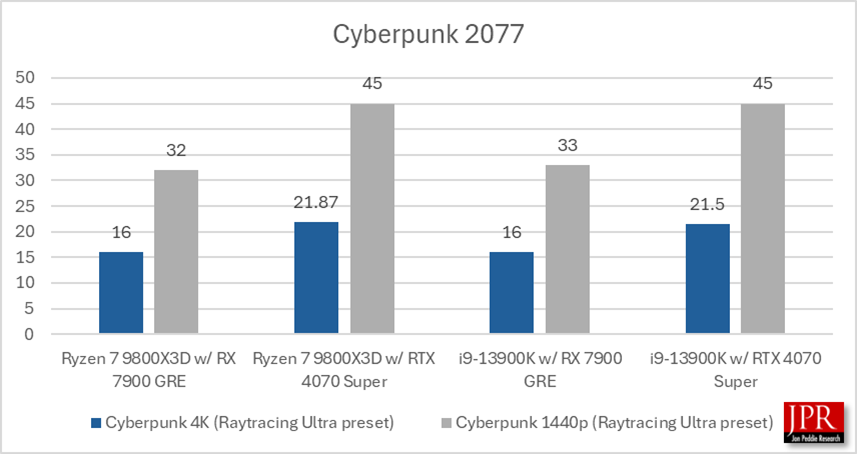
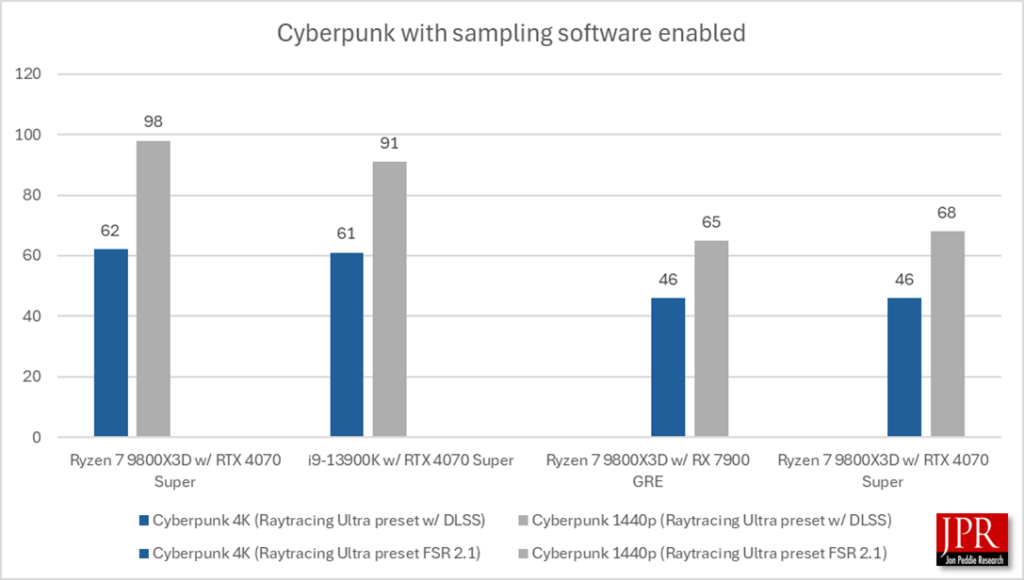
We tested multiple games with ray-tracing and sampling software where available. Call of Duty: Black Ops 6 is a new title that we have added to our suite.
Pmark calculations
JPR has been using its Pmark calculations to compare graphics boards for over a decade. The Pmark scores factor overall performance of the add-in board as well as its price and power.

| Ryzen 7 9800X3D w/ RX 7900 GRE | Ryzen 7 9800X3D w/ RTX 4070 | i9-13900K w/ RX 7900 GRE | i9-13900K w/ RTX 4070 Super | |
| Pmark games in 1440p | 160.30 | 186.90 | 154.98 | 183.73 |
| Pmark games in 4K | 99.91 | 107.33 | 95.04 | 105.39 |
| Pmark 3DMark suite | 122.68 | 133.80 | 120.30 | 129.95 |
| Power wattage (of CPU) | 120 | 120 | 125 | 125 |
| MSRP (of CPU as of Nov. 13, 2024) | $479 | $479 | $469 | $469 |
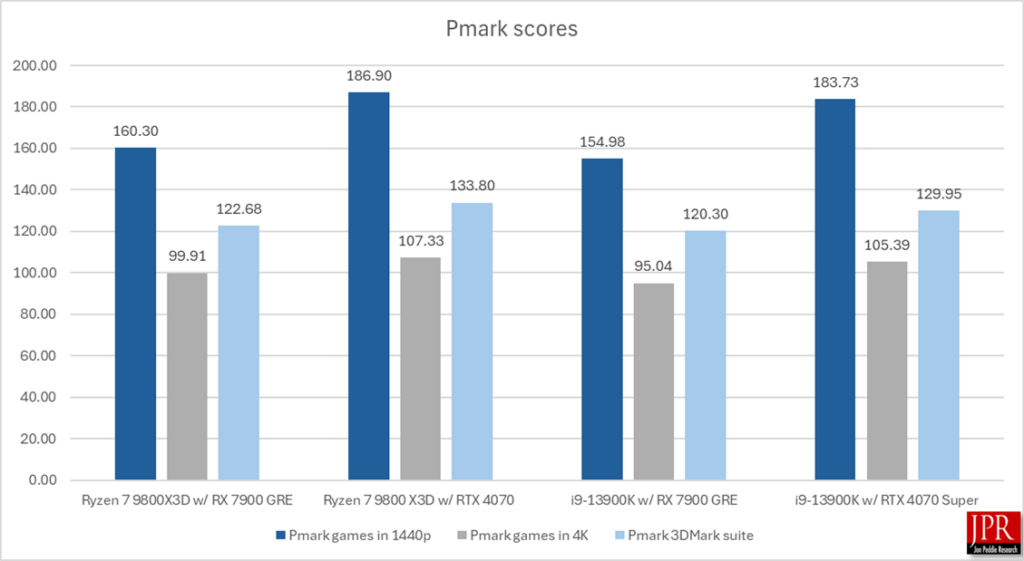
The Ryzen 7 slightly outperforms the Intel CPU in gaming frame rates while coupled with the RX 7900 GRE or the RTX 4070 Super. Also, the Ryzen 7 9800X3D uses less power than the Core i9. These advantages allow the new AMD CPU to outperform the i9-13900K in our Pmark calculations.