At CES 2024, Nvidia announced three new editions to its Ada Lovelace line of graphics cards: the RTX 4070 Super targeted at 1440p gaming, the RTX 4070 Ti Super for 4K and maxed-out gaming at 1440p, and the RTX 4080 Super for full ray-traced gaming at 4K.
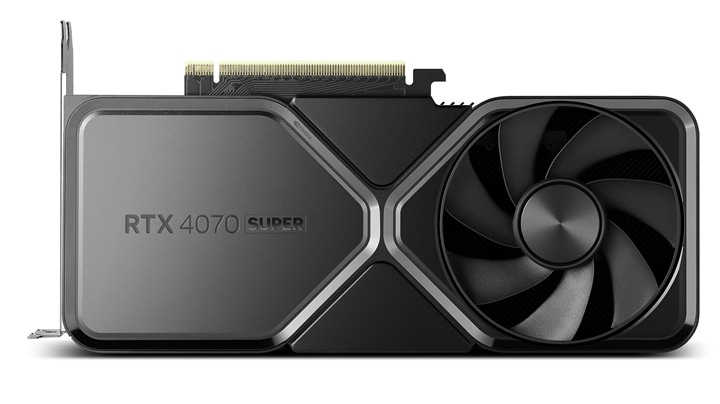
What do we think? If you are on the market to upgrade from an RTX 2000 or RTX 3000 series graphics card, the new RTX 4070 Super will be hard to beat for the price. The RTX 4070 Super is comparable in performance to the RTX 4070 Ti, which, at the time of publication, is still going for $769 on Newegg. That is over $160 more than the MSRP of the RTX 4070 Super. AMD’s Radeon RX 7800 XT provides solid performance at 1440p and at a lower price point, but if you are looking to bring ray tracing to 1440p gaming, then the RTX 4070 Super is the better choice for you.
We compared the new RTX 4070 Super to the RTX 4070 and the RTX 4070 Ti. Nvidia introduced its newest editions to the Ada Lovelace series at CES 2024 with the announcement of three new graphics cards: the RTX 4070 Super, the RTX 4070 Ti Super, and the RTX 4080 Super. The RTX 4070 Super is the first card that will be available to consumers, released on January 17. Our sister site BabelTechReviews posted a thorough review of the new Lovelace-based RTX 4070 Super, which can be read here. In this article, we will be taking the data and matching up the add-in boards with our JPR calculation (Pmark).
The RTX 4070 Super arrives with 20% more cores than the RTX 4070, making it faster than an RTX 3090 at a fraction of the power, with the RTX 4070 Super having a TDP of 220W versus a TDP of 350W for the RTX 3090. With DLSS 3 enabled, it stretches to a claimed 1.5× faster, while showing a 16% average improvement over the RTX 4070 gaming at 1440p.
The RTX 4070 add-in boards are based on Nvidia’s AD104 GPU. The chart below shows how the two boards stack up against one another.
| RTX 4070 Super | RTX 4070 | Percentage Change | |
| GPU | AD104 | AD104 | |
| CUDA Cores | 7,168 | 5,888 | 22% |
| RT Cores | 56 | 46 | 22% |
| TMU | 228 | 184 | 24% |
| Base Clock (MHz) | 1,980 | 1,920 | 3% |
| Boost Clock (MHz) | 2,475 | 2,475 | 0% |
| Memory (GB) | 12 | 12 | 0% |
| Memory Type | GDDR6X | GDDR6X | |
| FP32 (TFLOPS) | 35.48 | 29.15 | 22% |
| Memory Bus | 192 | 192 | 0% |
| Bandwidth | 504.2 | 504.2 | 0% |
| TDP | 220 | 200 | 10% |
| MSRP at Launch | $599 | $599 | 0% |
| Street Price | NA | $534 | |
Graphics card comparison of the RTX 4070 versus the RTX 4070 Super.
The new RTX 4070 Super is equipped with 7168 CUDA cores, a 22% increase over the RTX 4070, along with a 22% increase in ray-tracing cores and with a 10% increase in TDP. There was no onboard memory increase for the new Super graphics card, which might be limiting for gaming requirements down the line.
Below, we compare the add-in board specifications between the RTX 4070 Super and the RTX 4070 Ti.
| RTX 4070 Super | RTX 4070 Ti | Percentage Change | |
| GPU | AD104 | AD104 | |
| CUDA Cores | 7,168 | 7,680 | -7% |
| RT Cores | 56 | 60 | -7% |
| TMU | 228 | 240 | -5% |
| Base Clock (MHz) | 1,980 | 2,310 | -14% |
| Boost Clock (MHz) | 2,475 | 2,610 | -5% |
| Memory (GB) | 12 | 12 | 0% |
| Memory Type | GDDR6X | GDDR6X | |
| FP32 (TFLOPS) | 35.48 | 40.09 | -11% |
| Memory Bus | 192 | 192 | 0% |
| Bandwidth | 504.2 | 504.2 | 0% |
| TDP | 220 | 285 | -23% |
| MSRP at Launch | $599 | $799 | -25% |
| Street Price | NA | $769 |
Graphics card comparison of the RTX 4070 Ti versus the RTX 4070 Super.
Test bed
We benchmark using Nvidia FrameView on a recent install of Windows 11 Pro Edition 22H2 at 3440×1440, using an Intel Core i7-12700K with stock clocks and 32GB of DDR4 Corsair Vengeance RGB Pro (3,600 MHz) memory on an Asus Prime Z690-P D4 motherboard. All games and benchmarks are the latest versions, and we used the latest press drivers for our testing. The games tested, display driver, settings, and hardware are identical except for the GPUs that we compared.
Our benchmark suite consisted of multiple games with 14 different settings running DX11, DX12, and Vulkan, as well as 3DMark synthetic tests. All games were run at 3440×1440.
| Chernobylite (Ultra w/ RT) | Chernobylite (Ultra w/ RT & DLSS) |
| Cyberpunk 2077 + DLSS 2 Quality | Cyberpunk 2077 (DLSS 3 Quality w/ RT) |
| Cyberpunk 2077 Ultra | Doom Eternal (Ultra) |
| Forza Horizon 5 | Forza Horizon 5 (w/DLSS 2 Quality) |
| Forza Horizon 5 (w/DLSS 3 Quality) | Red Dead Redemption 2 (Ultra) |
| Red Dead Redemption 2 (Ultra w/ DLSS) | Resident Evil 4 (Ultra) |
| Shadow of the Tomb Raider (Ultra) | Total War: Warhammer III |
BabelTechReviews’ benchmark suite.
Testing results
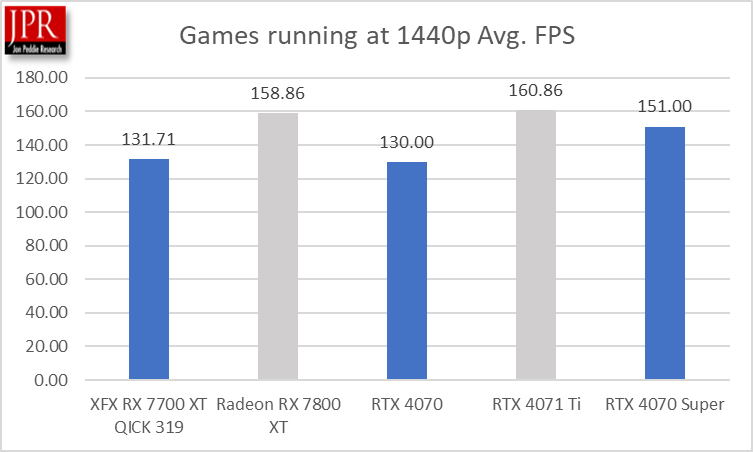
The RTX 4070 Super shows an average performance jump of 16% over the RTX 4070, and only a 6% drop from the RTX 4070 Ti, despite using 23% less power and with a price point that is 25% below the RTX 4070 Ti.
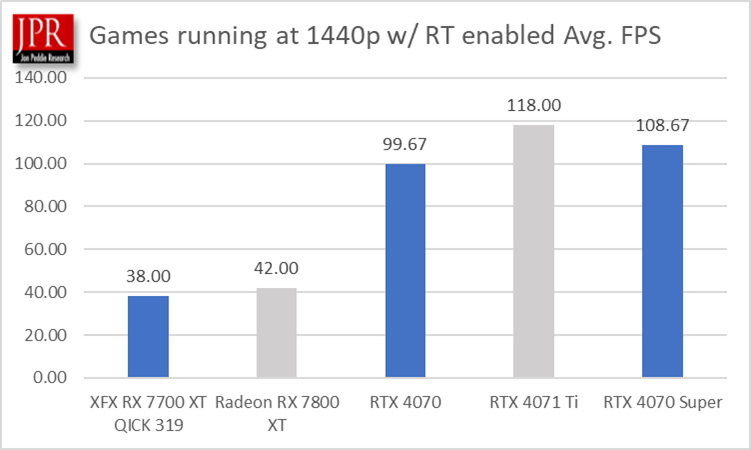
The Radeon RX 7700 XT and RX 7800 XT hold their own in 1440p gaming, but once ray tracing is enabled, the Nvidia add-in board pulls away in performance.
Pmark calculations
JPR has been using its Pmark calculations to compare graphics boards for over a decade. The Pmark scores factor overall performance of the add-in board as well as its price and power.

| RTX 4070 Super | RTX 4070 Ti | RTX 4070 | Radeon RX 7700 XT | Radeon RX 7800 XT | |
| FPS all games | 151 | 161 | 130 | 132 | 159 |
| FPS with RT enabled | 109 | 118 | 100 | 38 | 42 |
| TFLOPS | 35.48 | 40.09 | 29.15 | 35.17 | 37.32 |
| TDP (W) | 220 | 285 | 200 | 245 | 263 |
| MSRP (at launch) | $599 | $799 | $599 | $470 | $499 |
Pmark variables.
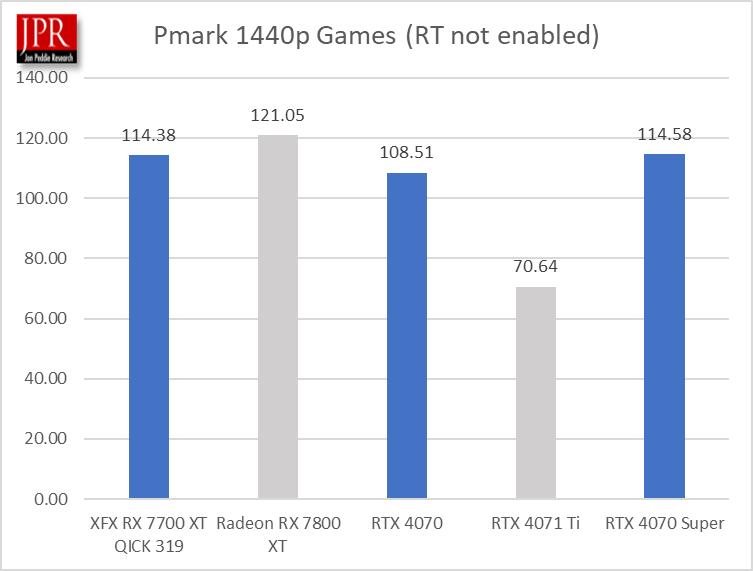
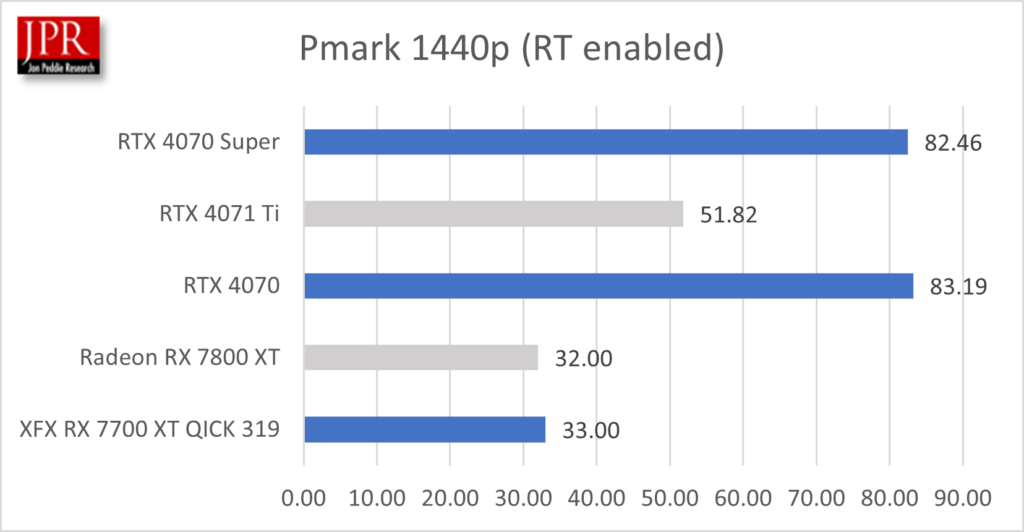
The RTX 4070 Super is competitive with the RX 7700 XT and RX 7800 XT, despite the AMD AIBs coming in at a lower $499 price point compared to the RTX 4070 Super at $599.
The RTX 4070 Super and RTX 4070 both hold a clear advantage over their AMD counterparts in Pmark calculations with ray tracing enabled. The RTX 4070 Super has a performance advantage over the RTX 4070, showing a 9% performance increase in frames per second in games running ray tracing.
Where is the market going?
Right now on Newegg and Amazon, you can still find the RTX 4070 Super at its MSRP of $599; however, they can sell for as high as $649. Although graphics card prices remained stable through much of 2023, prices started to escalate again beginning in late Q3, and that trend has continued. For example, the RTX 4070 Ti debuted a year ago at a $799 price point; that price has held all year, and now on sites such as Best Buy, the Ti can go for as high as $849.
AMD’s RTX 7800 XT released in August 2023 at $499 and is selling for $549 now on Newegg.

Both AMD and Nvidia are releasing new cards into the stack early in 2024. This could have a stabilizing effect on prices in the short term. If you are in the market to upgrade your add-in board, now might be the best time to do so.