We’re impressed with the RTX 5080—it brings bleeding-edge performance without the hefty price tag. It delivers exceptional price-performance value, combining state-of-the-art graphics processing capabilities with an accessible price point.
Nvidia has released the RTX 5090 and RTX 5080 AIBs. In addition to the two new add-in boards themselves, they come in a bulletproof shipping container—the light gray box in the background of the image below. Mario Vasquez will have more to say about that in his review on JPR’s sister site BabelTechReviews.
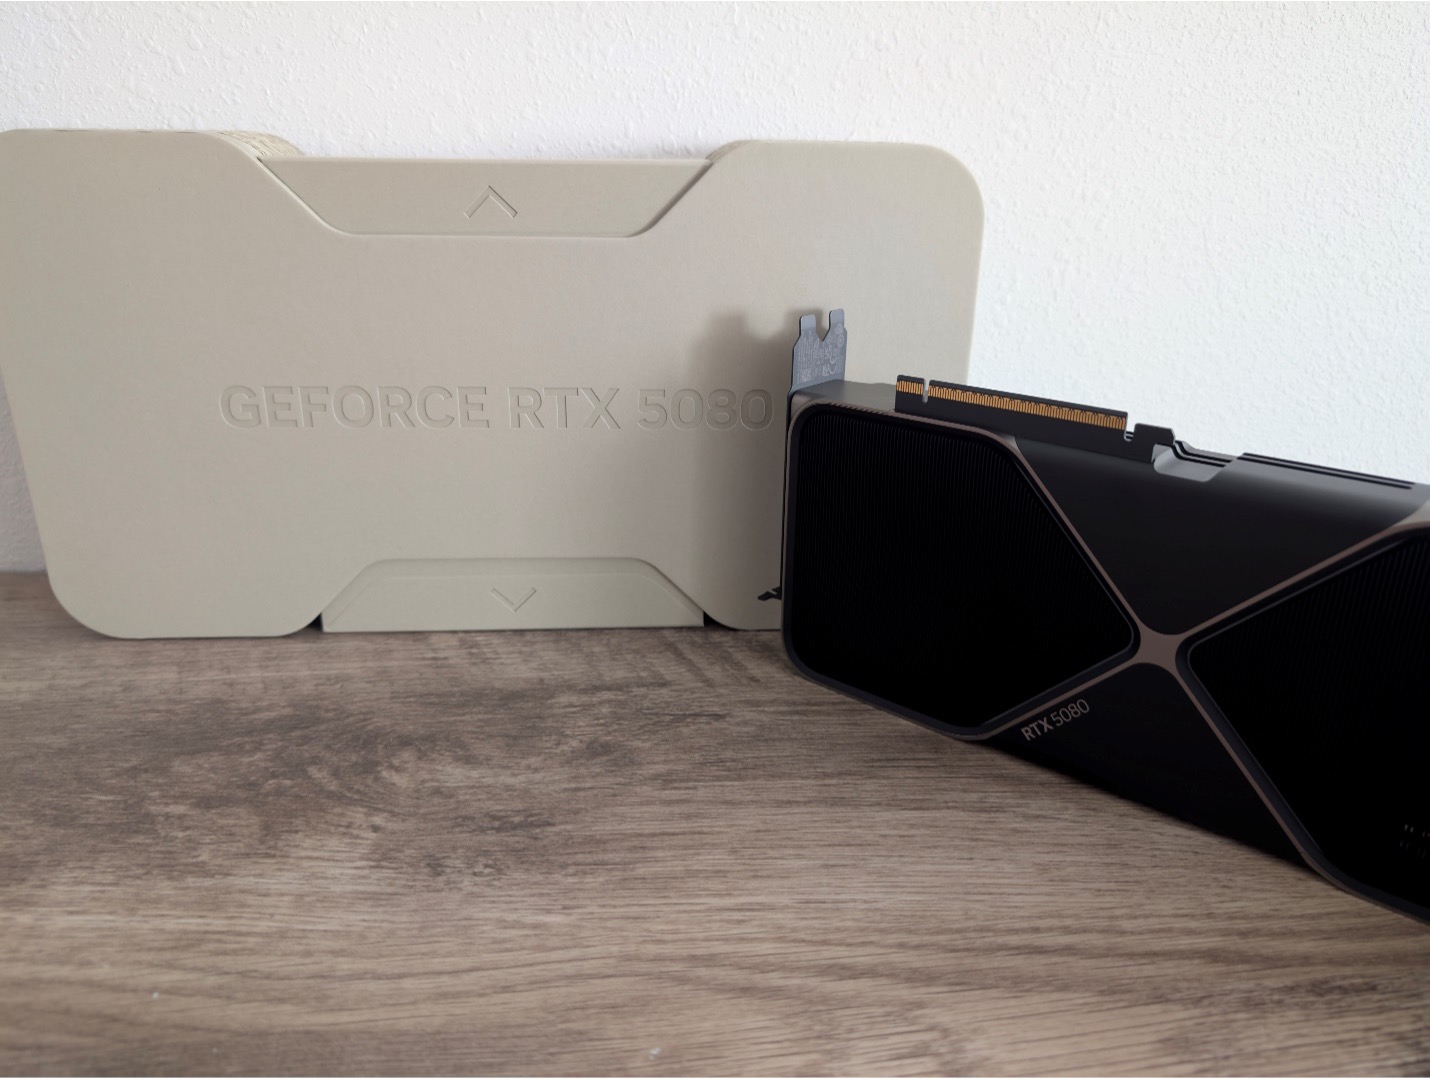
The RTX 5080 sells for $999, making it not cheap, but also not crazy expensive. But, if you bought an RTX 4080, you’re probably not ready to put it up on eBay and buy an RTX 5080. But, what if you were struggling with an RTX 3080? When you see the test results we got in our Mt. Tiburon Test Lab (MTTL), the RTX 5080 is going to look pretty damn inviting. Also, the 5080 will run DLSS 3 and DLSS 4 games, whereas the 4080 can only run DLSS 2-level games. And although the 5080 draws more power than the 4080 and, therefore, the 4080 Super beats it in our Pmark, the 5080 kills the RTX 3080 Ti we tested. The 3080 Ti was priced at $1,199. The 3080 was $699. The Ti is “almost 3090-like,” but 7% slower.
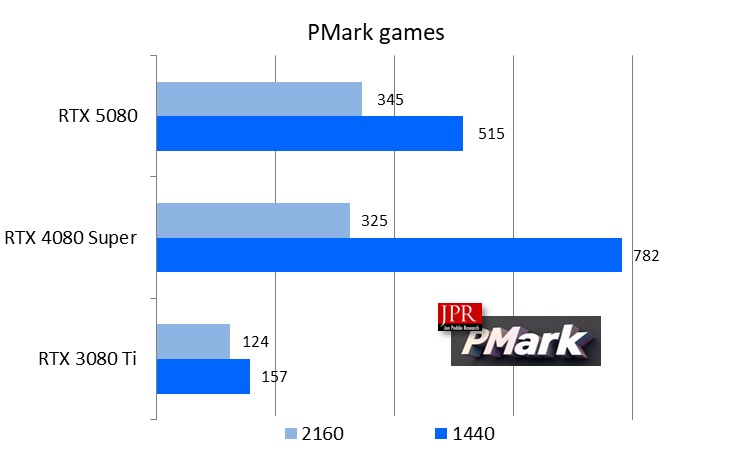
The Pmark compares the performance times the price times the reciprocal of the power, and a higher result is better.
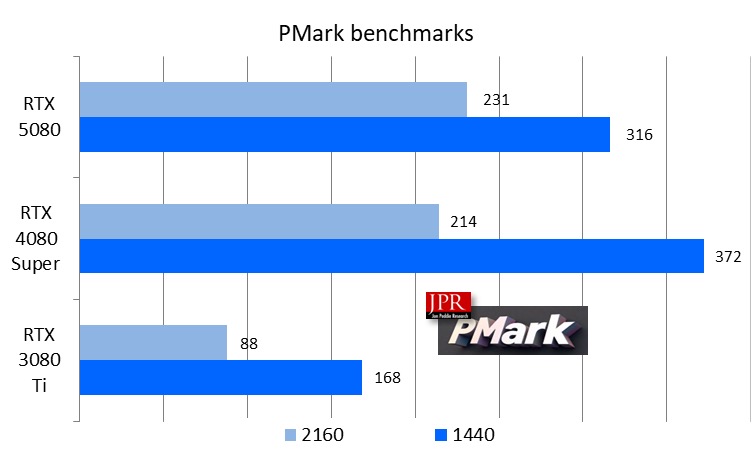
The specific gaming tests, for three resolution tests (4K, 1440, and HD), show the RTX 5080 being 67% better on average than the RTX 3080 Ti, and 13% better than the illustrious RTX 4080 Super.
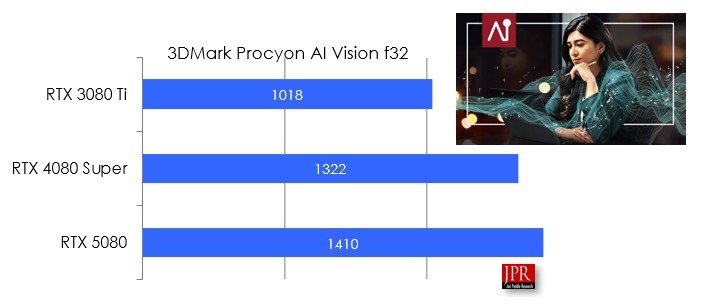
We also ran UL’s Procyon AI Computer Vision benchmark, and the 5080 shined.
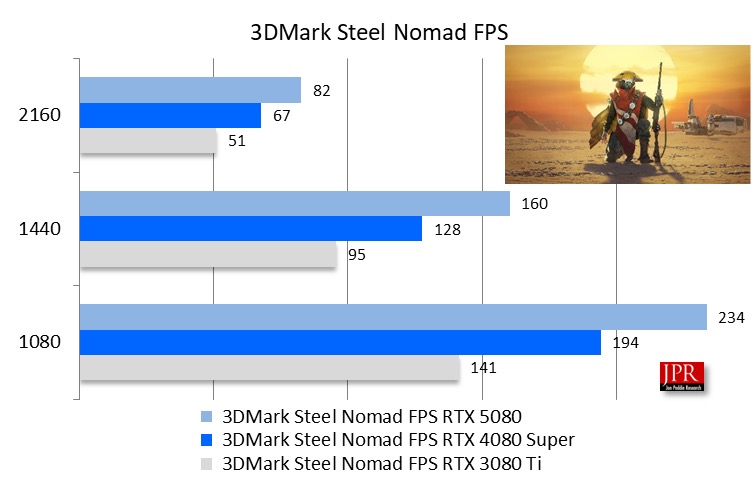
In all three resolutions, the 5080 beat the 4080 Super and 3080 Ti in UL’s Steel Nomad, which measures how an AIB performs in a non-ray-traced game-like workload.
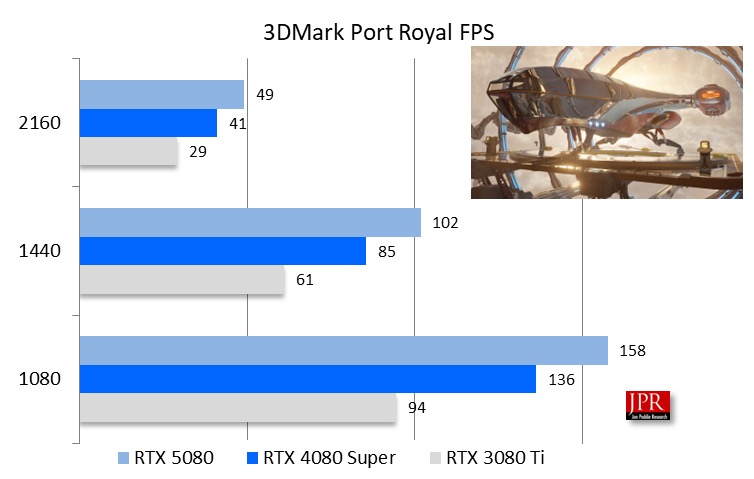
3DMark Port Royal tests a computer’s graphics card performance in real-time ray tracing.
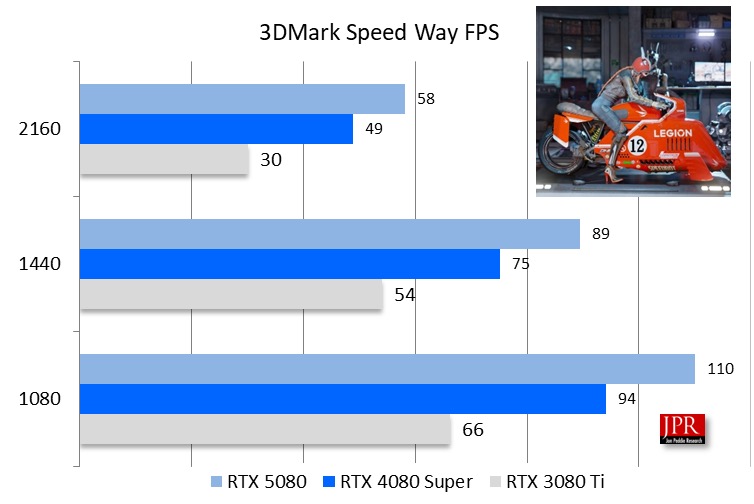
We also ran 3DMark’s Speed Way benchmark, which tests an AIB using DirectX 12 Ultimate. It evaluates the GPU’s performance in rendering realistic lighting and reflections.
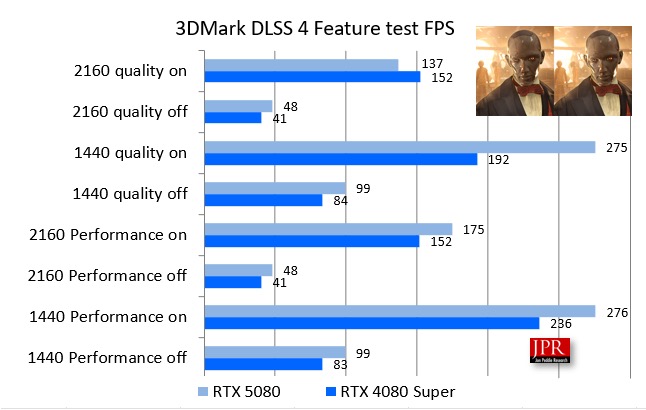
We couldn’t test the RTX 3080 Ti on DLSS 4 or DLSS 3, but we did get the RTX 4080 Super to run 3DMark’s DLSS 4 tests using Nvidia’s 572.02 driver. The test runs the Port Royal benchmark twice, once with DLSS disabled and once with DLSS enabled.
A Basemark GPU Breaking Limit test is a benchmark designed to push an AIB to its performance limits by utilizing demanding ray-tracing capabilities. It’s a test to see how far you can break your GPU’s performance boundaries with intense graphics processing.
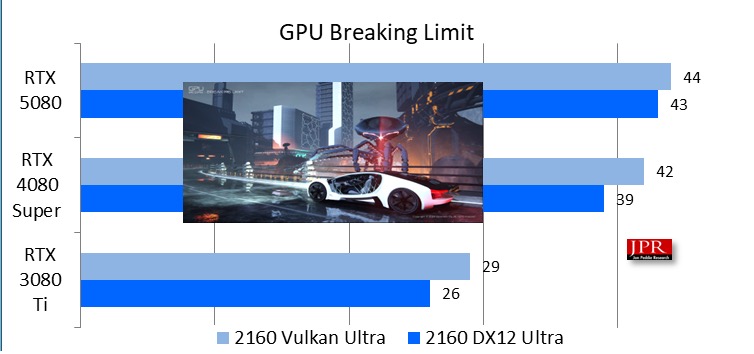
The Basemark tests pretty much reflected the overall average of the performance differences between the three AIBs.
For games, we used those with built-in benchmarks.
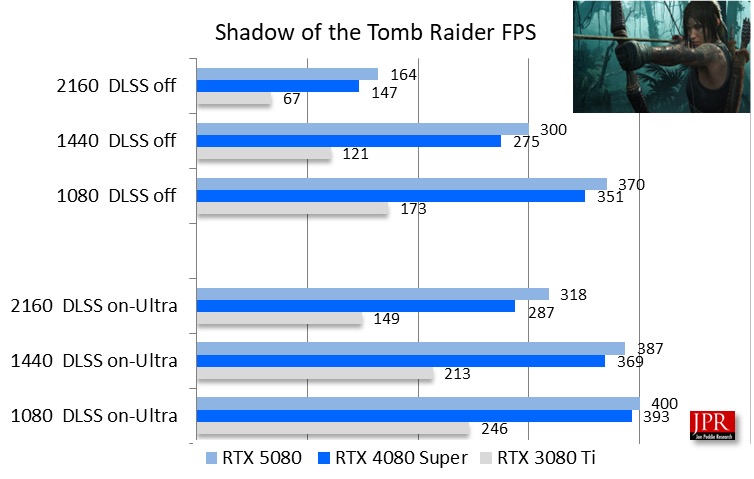
Always a favorite, Shadow of the Tomb Raider showed great scalability across the three AIBs.
There are very few games with better, or more eye candy than Cyberpunk 2077. But the AIB really has to work to deliver that flash, imagery, and neon, which makes it a perfect benchmark for a ray-tracing accelerator AIB.
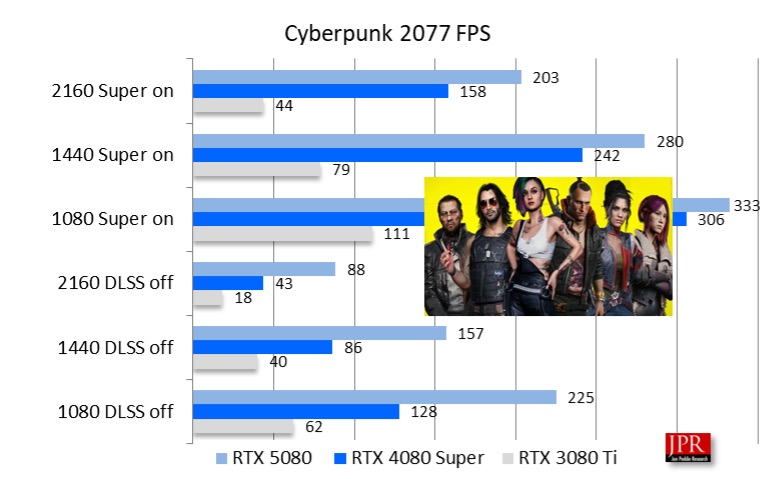
Once again, we see terrific scaling from generation to generation of the RTX AIBs.
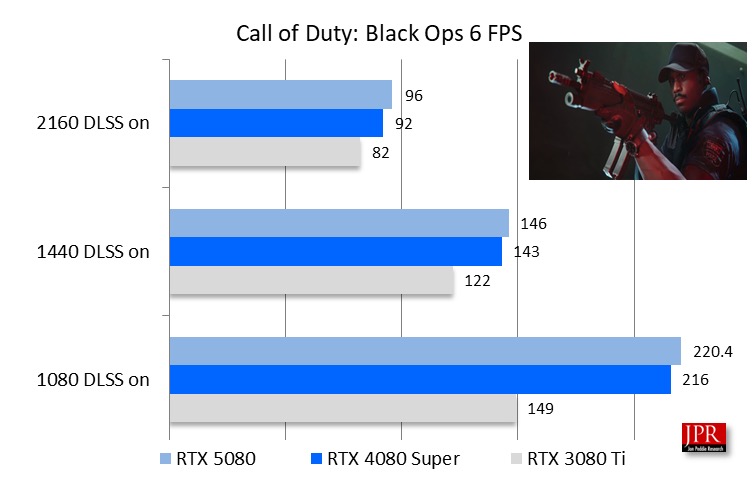
But for heart-pounding (maybe heart-stopping) action, combined with sound, and almost unbelievably well rendered characters, you can’t beat Call of Duty: Black Ops 6.
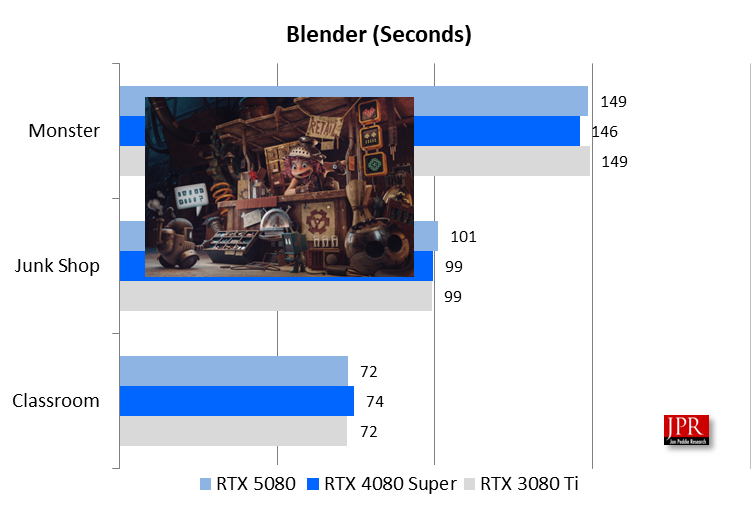
Anyone who is doing anything in digital content creation is probably using Blender. Blender has had ray tracing for quite a while and used it effectively in various movies the Blender crowd has made. To give users a hint as to what to expect from a graphics AIB they might be anticipating of buying, Blender has built in a benchmark test.
Benchmarking is fun, and it’s tedious, and a lot of work.
The test platform was the same as the one we used for the first RTX 5090 AIB:

JPR has just concluded a massive review of Nvidia’s new 5000 add-in boards at its three testing labs. Fourteen AIBs were tested across 34 games and 12 synthetic benchmarks, plus several built-in game benchmarks, at three resolutions (4K, 1440, and HD)—17,136 tests in all.
You can see all the benchmarks here and here in our review and BabelTechReviews testing of the RTX 5090, respectively. BabelTechReviews’ RTX 5080 Founders Edition review can be found here.
As for this review, we think the RTX 5080 is a real value winner, delivering state-of-the-art performance at an affordable price.
LIKE WHAT YOU’RE READING? INTRODUCE US TO YOUR FRIENDS AND COLLEAGUES.